How to interpret an audiogram
An audiogram is the main output of a hearing test. Audiologists commonly use this type of test output to document and analyse their patient’s hearing threshold across different frequencies.
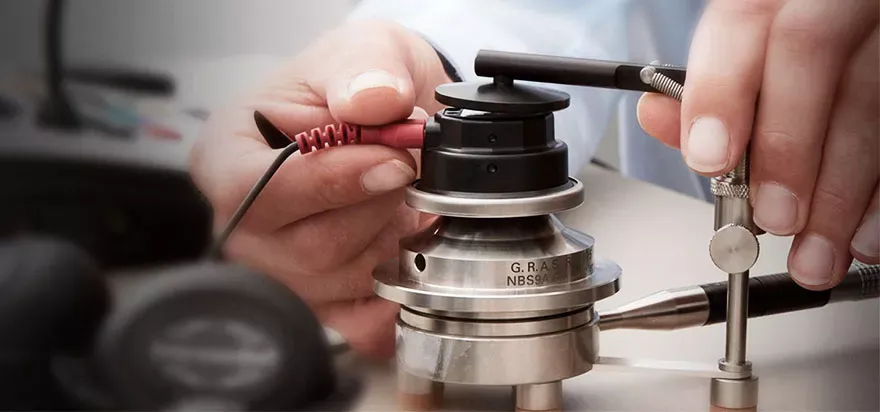
Audiologists record audiogram results using pure-tone audiometry, which is the gold standard for understanding type, level, and pattern of hearing loss. Pure-tone audiometry is widely available, very dependable, and simple to perform.
Audiogram interpretation is crucial for an audiologist to be able to recommend appropriate hearing loss interventions. The results provide a basis for diagnosis, reassurance, monitoring, or further investigation of any ear concerns. Some options for treating hearing loss include hearing aids, cochlear implants, and surgery.
There are three types of hearing loss:
- Conductive hearing loss: is hearing loss in the external ear or middle ear
- Sensorineural hearing loss: is inner ear hearing loss
- Mixed hearing loss: is when conductive and sensorineural hearing loss occur together
How to read an audiogram
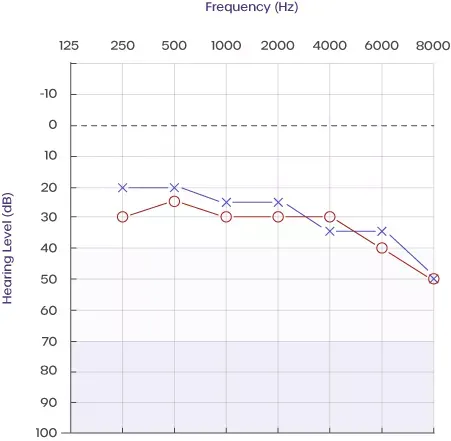
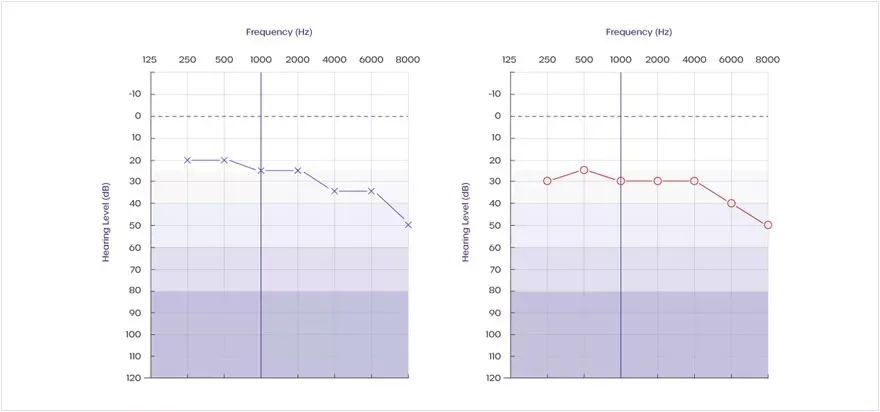
Figure 1. Example of an audiogram
The horizontal axis (x-axis)
This represents frequency (pitch) from lowest to highest (left to right). The lowest frequency tested is usually 125Hz, and the highest frequency is usually 8000Hz.
We test these frequencies because most speech falls into the 250 to 6000 Hz range. Vowel sounds are among the lowest frequencies and consonants such as S, F, SH, CH, H, TH, T and K sounds are among the higher frequencies.
The vertical axis (y-axis)
The y-axis of the audiogram shows the intensity (loudness) of sound, measured in decibels (dB HL). The graph shows the lowest or softest sound levels at the top and the loudest or highest at the bottom.
Air conduction
Testing with headphones is known as air conduction (AC) testing. This is because the sound travels through the air in the ear canal to reach the inner ear.
- A red “O” marks the air conduction results for the right ear
- A blue “X” marks the air conduction results for the left ear
Bone conduction
Bone conduction testing uses a device (bone oscillator) behind the ear to transmit sound through the mastoid bone. It’s marked with a “>“ or a “<” symbol. Depending on the region this symbol can differ.
Each symbol on the graph represents the bone conduction threshold for a given frequency. When all the thresholds are measured and plotted on the graph, they’re connected to form easy-to-read lines. This is done for both the left and right ears.
If the two lines overlap, we consider the hearing loss symmetrical - meaning it’s essentially the same in both ears. If the lines don’t overlap, hearing loss is considered to be asymmetrical, i.e., each ear has a different level of hearing loss. Hearing loss should occur equally in both ears.
What’s a normal level on an audiogram?
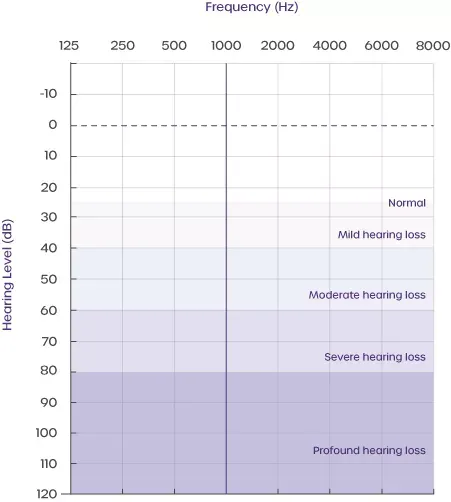
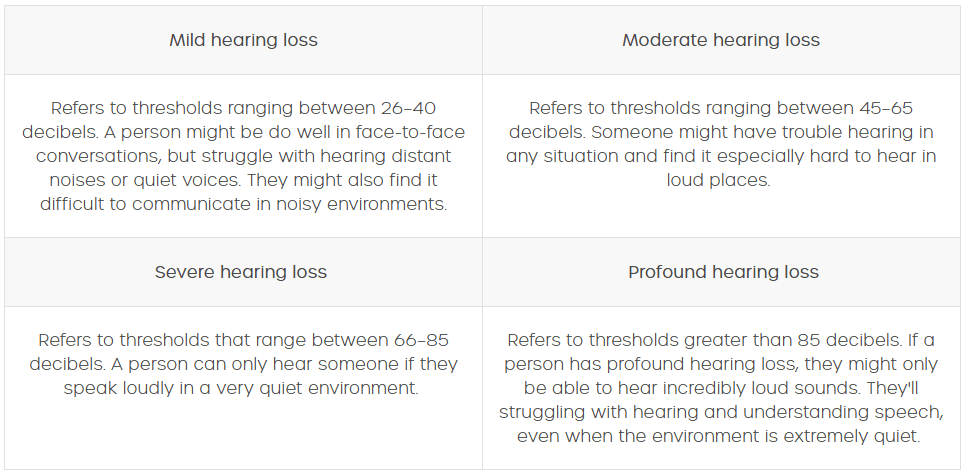
Figure 2. Hearing loss categorisation
A hearing specialist can determine how severe the hearing loss is by reviewing where the symbols are on the graph. There are many potential levels of hearing loss:
Diagnostic audiometers
It’s important to have routine hearing tests to identify any signs of hearing loss at an early stage. Hearing tests can be done in the community, at work, or by visiting a doctor or audiologist.
At Amplivox, we’ve developed a suite of innovative and user-friendly diagnostic audiometers to suit a whole range of hearing loss pathologies.
The Model 270+ is an advanced diagnostic audiometer used by audiologists, ENTs, and hearing aid suppliers. The device includes manual and automatic testing for bone conduction, as well as air conduction (Hughson Westlake and Békésy). Along with intuitive tools that help hearing professionals to diagnose hearing loss issues quickly and efficiently.
To learn more about the Model 270+, you can visit our webpage. Or contact our customer support team on +44 (0)1698 208216 or via email.